neo4j管理模型yEd展现

neo4j管理模型yEd展现

背景

模型的管理,尤其是模型间血缘的管理,向来是件比较麻烦的事情。

现在就来结合图数据库(neo4j)和图形编辑器(yEd Graph Editor)分享下我自己的经验。

前置准备

要管理模型,必然需要有模型关系;要管理血缘,必然需要有血缘关系;

为了方便维护、多人协同,这里分两个文件,使用xlsx来管理以上的信息

管理模型的model.csv:

image-20211230101653342

name标示结点,relation标示关系,这里只有字段归属表的关系,表不存在关系;

除了这两个字段外,其他字段都可视为结点的属性,使用中可以按需扩展。

管理血缘的relation.csv:

image-20211230101830793

name标示结点,relation标示关系,这里只有字段与字段的依赖关系,不存在依赖关系的结点不用体现;

除了这两个字段外,其他字段都可视为字段与字段间关系的属性,使用中可以按需扩展。

导入neo4j

按照上述文件整理好基本信息后,下一步就是登录neo4j,然后执行脚本将csv文件导入图数据库

1、导入前可先删除已经存在的数据信息

1
2
MATCH (r:`统计模型`)
DETACH DELETE r

2、导入管理模型的归属关系

1
2
3
4
5
6
7
8
9
10
11
12
13
14
15
16
17
18
19
20
21
22
23
24
25
26
27
28
29
30
call apoc.load.csv(
'import/model.csv',
{header:true,limit:1000,
mapping:{
name:{type:'string'},
comments:{type:'string'},
field:{type:'string'},
ttype:{type:'string'},
level:{type:'string'},
relation:{array:true,arraySep:';',nullValues:['na','无']},
info:{type:'string'},
ctype:{type:'string'},
code:{type:'string'},
tableno:{type:'string'}
}
}
) yield map
with map
merge(n:统计模型 {name:map.name})
on create set n.comments=map.comments,n.level=map.level,
n.field=map.field,n.ttype=map.ttype,
n.ctype=map.ctype,n.code=map.code,
n.tableno = map.tableno,
n:统计模型
with n,map
unwind map.relation as relation
unwind map.info as info
merge(w:统计模型{name:relation})
merge(n) - [:归属 {roles:map.info }] -> (w)
return count(*)

3、导入管理血缘的依赖关系

1
2
3
4
5
6
7
8
9
10
11
12
13
14
15
16
17
18
19
20
21
22
23
24
25
call apoc.load.csv(
'import/relation.csv',
{header:true,limit:1000,
mapping:{
name:{type:'string'},
comments:{type:'string'},
field:{type:'string'},
ttype:{type:'string'},
level:{type:'string'},
relation:{array:true,arraySep:';',nullValues:['na','无']},
info:{type:'string'}
}
}
) yield map
with map
merge(n:统计模型 {name:map.name})
on create set n.comments=map.comments,n.level=map.level,
n.field=map.field,n.ttype=map.ttype,
n:统计模型
with n,map
unwind map.relation as relation
unwind map.info as info
merge(w:统计模型{name:relation})
merge(n) - [:依赖 {roles:map.info }] -> (w)
return count(*)

4、细节优化:

按需增加标签,通过调整标签的大小、颜色可在neo4j中直观的感受出各类结点;表和字段一组,用大小区分;维度和度量一组,用颜色区分;

1
2
3
4
5
6
7
8
9
10
11
12
13
14
15
16
17
18
19
MATCH (n:`统计模型`) 
where n.ttype = 'table'
set n:table
RETURN n LIMIT 2500

MATCH (n:`统计模型`)
where n.ttype = 'field'
set n:field
RETURN n LIMIT 2500

MATCH (n:`统计模型`)
where n.ctype = '维度'
set n:维度
RETURN n LIMIT 2500

MATCH (n:`统计模型`)
where n.ctype = '度量'
set n:度量
RETURN n LIMIT 2500

5、查询导入后的数据

1
MATCH (n:`统计模型`) RETURN n

导出neo4j数据

在neo4j的web界面中查询数据还不大直观,这里可将核心信息导出为json信息,并转化为需要的格式数据

1、从neo4j中导出全量数据

1
2
3
match data=(na:`统计模型`)-[*1..8]->(nb:`统计模型`) 
where id(nb) <> 372
return nodes(data),relationships(data)

这里的 id(nb) <> 372 指不导出自动生成的辅助结点,模型中表没有关系,所有数据库自动建立了一个辅助结点连接表。
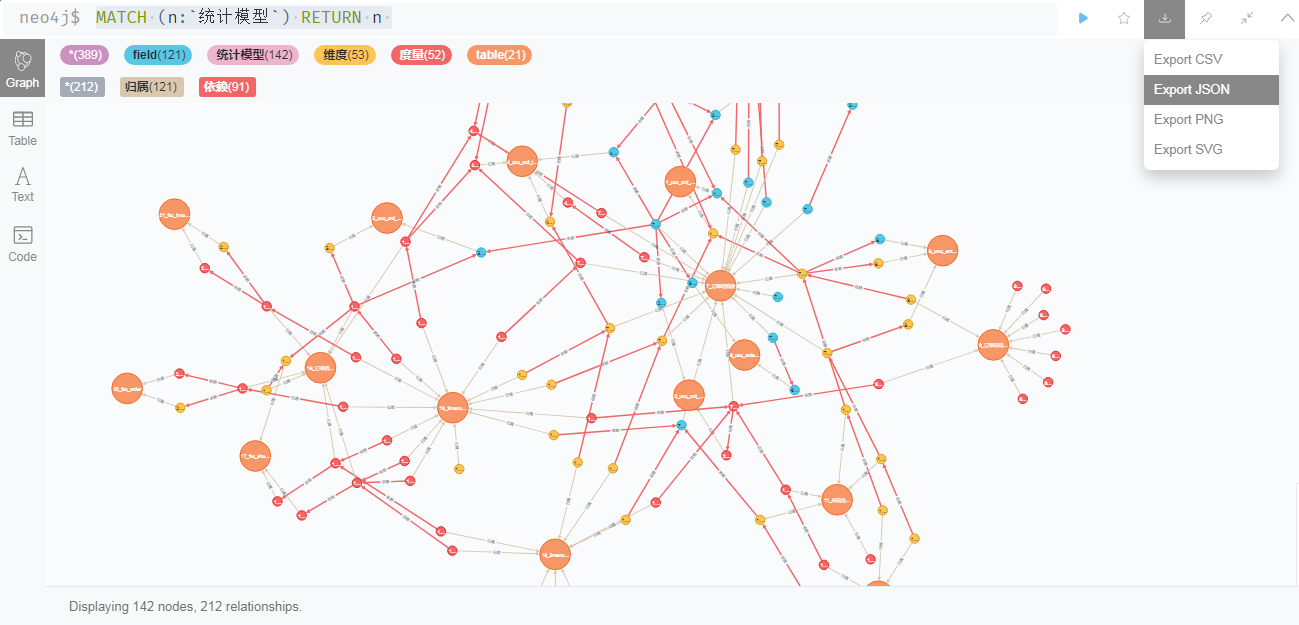
image-20211230104209368

2、导出为JSON文件,并通过 python 转换为csv文件,然后将csv另存为xlsx文件

1
2
3
4
5
6
7
8
9
10
11
12
13
14
15
16
17
18
19
20
21
22
23
24
25
26
27
28
29
30
31
32
33
34
35
36
37
38
39
40
41
42
43
44
45
46
47
48
49
50
import json 
from pandas import json_normalize
import pandas as pd

# 读取json文件,注意编码类型: encoding='utf-8-sig' 也可不指定
file_name = 'records.json'
with open(file_name, 'rb') as file_obj:
fileJson = json.load(file_obj,strict=False)
file_obj.close()

# 将JSON文件转换为Dataframe
df = json_normalize(fileJson)

# 提取第一列的 节点信息:nodes(data)
df_nodes = df['nodes(data)']
# 通过循环将每一个list转成dataFrame并存在一起
pd_json = pd.DataFrame(df_nodes[0])
for i in range(1,len(df_nodes)) :
df_node = pd.DataFrame(df_nodes[i])
pd_json = pd.concat([pd_json, df_node], axis=0)

# 对节点信息按照ID进行去重处理
pd_json_node =pd_json.drop_duplicates(subset='identity',keep='first')
# 提取属性信息
# 通过增加一列提取name信息,单元格中为dict字典类型,直接提取name信息即可
pd_json_node['Label']=pd_json_node['properties'].apply(lambda x:x['name'])
pd_json_node['comments']=pd_json_node['properties'].apply(lambda x:x['comments'])
pd_json_node['groupid']=pd_json_node['properties'].apply(lambda x:x['tableno'])
pd_json_node['type']=pd_json_node['properties'].apply(lambda x:x['ttype'])
pd_json_node['Id']=pd_json_node['identity']

# 提取第二列的 关系信息:relationships(data)
df_relations = df['relationships(data)']
# 通过循环将每一个list转成dataFrame并存在一起
pd_json = pd.DataFrame(df_relations[0])
for i in range(1,len(df_relations)) :
df_relation = pd.DataFrame(df_relations[i])
pd_json = pd.concat([pd_json, df_relation], axis=0)

# 对关系信息按照ID进行去重处理
pd_json_relation =pd_json.drop_duplicates(['start','end'],keep='first')
pd_json_relation['Source']=pd_json_relation['start']
pd_json_relation['Target']=pd_json_relation['end']

# 将节点信息与关系信息组合到一个DataFrame中进行输出
# 进行全值关联,没有关联上的用nan占位
pd_yEd_file = pd.merge(pd_json_relation,pd_json_node,left_on=['Source'], right_on=['Id'], how='outer')

yEd_file_name = 'yEd_file.csv'
pd_yEd_file.to_csv(yEd_file_name, encoding="utf_8_sig")

yEd导入xlsx文件

1、打开xlsx文件

  • 配置data信息
    选择Edge List模式

    配置边信息
        框选边属性,start--end
            内容Adopt到 Data Range中
            Source IDs 对应 start列
            Target IDs 对应 end列
     配置节点信息
         框选节点属性,Label--Id
            内容Adopt到 Data Range中
            Node IDs 对应 Id列
            Group Node IDs 对应 groupid列
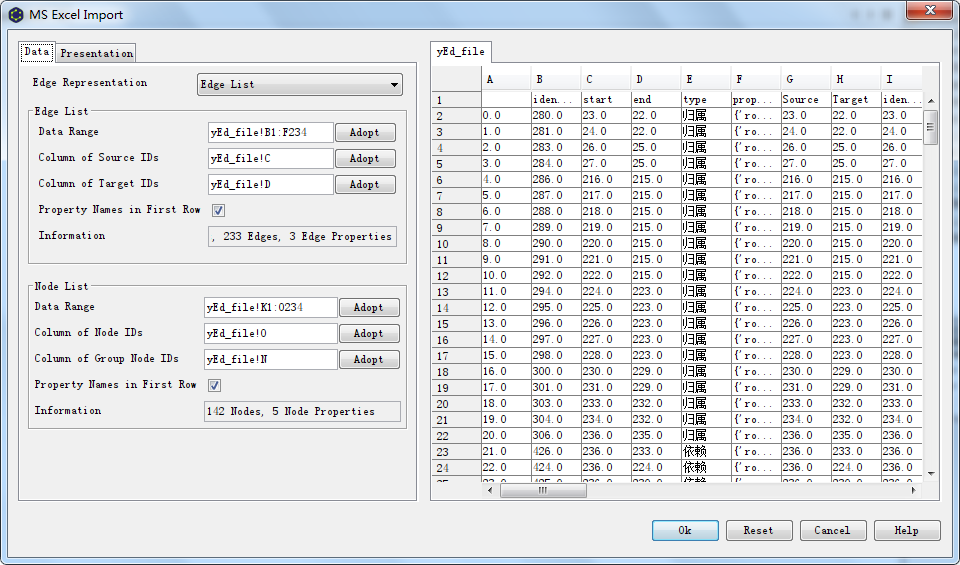
    

    image-20211230111818298

  • 配置presentation信息

    配置节点信息
          Label Text 对应 comments列            在框选节点属性时选择的列
          勾选Fit Size to Label  边框自适应字段长度
      配置边信息
           Label Text 对应 type列                       在框选节点属性时选择的列
           Template 选择 Directed Polyline 有向箭头
      布局风格
           Layout 推荐 Organic模式       <font color='red'> **设置后可以排列为从下往上的布局方式**  </font>
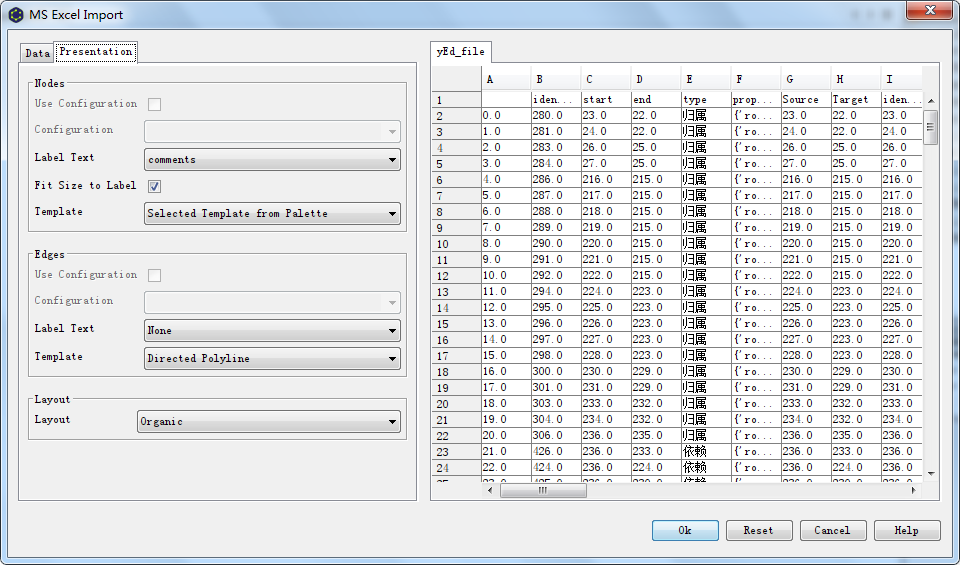
    

    image-20211230111835604

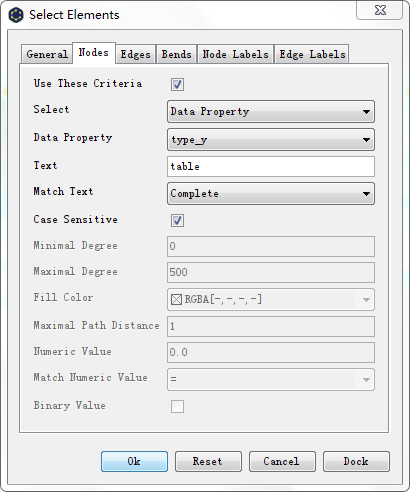
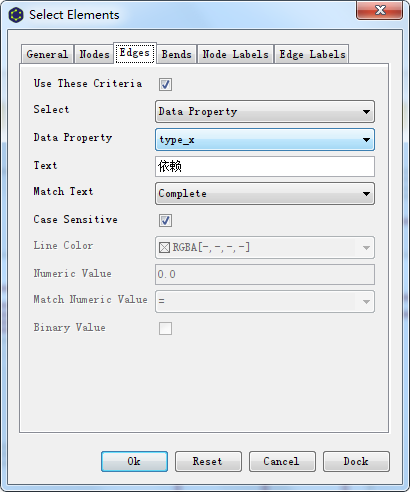
2、细节优化: Tools – Select Elements

  • 点击自动布局,进行有序排列
  • 选择特定结点,统一修改样式
  • image-20211230120841105
  • 选择特定边,统一修改样式
  • image-20211230121121627

3、最终效果:

image-20211230121230803